Simulics Reverse Debugger for Embedded Platforms
A Backstep Ahead!
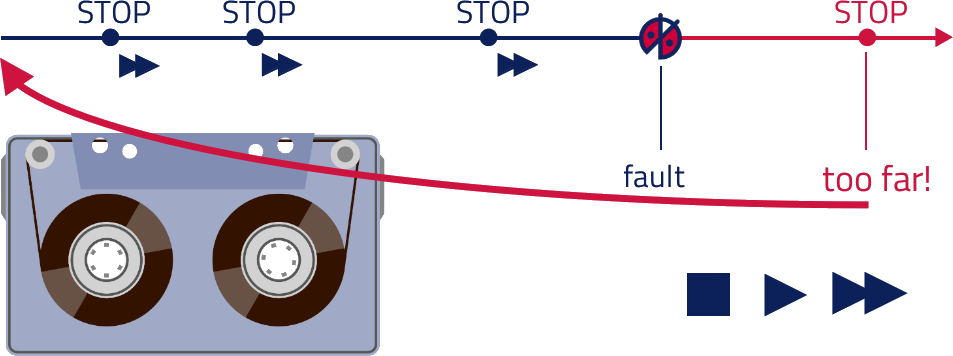
In the conventional debugging process, developers must inspect program states at breakpoints carefully.
Once passed, program states cannot be re-inspected to gather additional information.
The program must be restarted.
Not only is this tedious and annoying, but non-deterministic behavior as caused by IRQs and race conditions cannot be reproduced safely in each successive run.
With the Simulics Reverse Debugger, developers do not need to know in advance what they are looking for.
The program can be run without breakpoints and without error hypothesis.
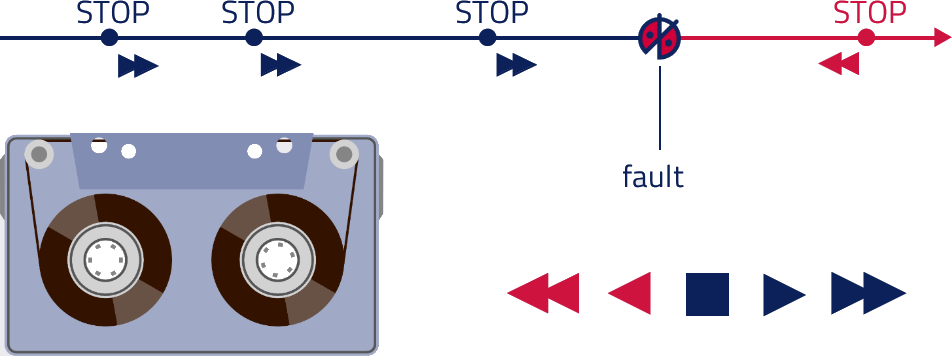
When an error occurred, developers can run back in time and investigate what did happen.
They do no more need to capture all the information that might be relevant before continuing program execution.
Developers can step the program back and forth, like forwarding and rewinding a tape.
Every position in program runtime can be inspected many times.
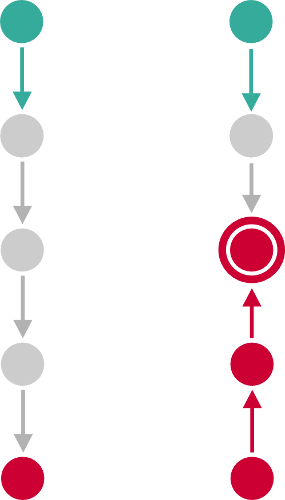
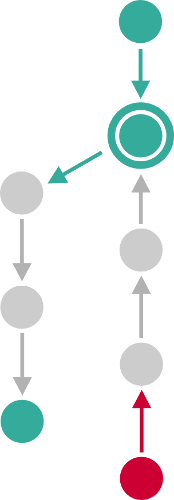
 Conventional Debugging
 – Program must be restarted
 Reverse Debugging
 – We added a
Rewind Button!
Features at a Glimpse:
- Free movement in program runtime, back and forth
- Deterministic analysis of IRQs and race conditions without restarting the program
- Backstep at the instruction, source line, function, breakpoint or watchpoint level
- Complete visibility of all register and memory contents for every point in time
- Works for any target operation system and bare metal applications
- Does not require a hardware target
